Understanding Hypothesis Testing

Hypothesis testing is the bedrock of the scientific method and by implication, scientific progress. It allows you to investigate a thing you’re interested in and tells you how surprised you should be about the results. It’s the detective that tells you whether you should continue investigating your theory or divert efforts elsewhere. Does that diet pill you’re taking actually work? How much sleep do you really need? Does that HR-mandated team-building exercise really help strengthen your relationship with your coworkers?
Social media and the news saturates us with “studies show this” and “studies show that” but how do you know if any of those studies are valid? And what does it even mean for them to be valid? Although studies can definitely be affected by the data collection process, the majority of this article is going to focus on the actual hypothesis test itself and why being familiar with its process will arm you with the necessary set of skills to perform replicable, reliable, and actionable tests that drive you closer to the truth - and to call bullshit on a study.
In any hypothesis test, you have a default hypothesis (the null hypothesis) and the theory you’re curious about (the alternative hypothesis). The null hypothesis is the hypothesis that whatever intervention/theory you’re studying has no effect. For example, if you’re testing whether a drug is effective, the null hypothesis would state that the drug has no effect while the alternative hypothesis would posit that it does. Or maybe you’d like to know if a redesign of your company’s website actually made a difference in sales — the null hypothesis is that the redesign had no effect on sales and the alternative hypothesis is that it did.
Hypothesis testing is a bit like playing devil’s advocate with a friend, but instead of just trolling, you both go out and collect data, run repeatable tests, and determine which of you is more likely to be right. In essence, having a null hypothesis ensures that the data you’re studying is not only consistent with whatever theory you have, but also inconsistent with the negation of your theory (i.e. the null hypothesis).
How a hypothesis test works
Once identifying your null and alternative hypotheses, you need to run the test. Skipping over a bunch of math formulas, it goes something like this:
- Perform an experiment (this is where you collect your data).
- Assume that the null hypothesis is true and let the p-value be the probability of getting the results at least as extreme as the ones you got.
- If the p-value is quite small (i.e. < 5%), your results are statistically significant which gives you evidence to reject the null hypothesis; otherwise, the null hypothesis can’t be ruled out just yet.
You might be wondering why a p-value of 5% could mean that your results are statistically significant. Let’s say your null hypothesis is that condoms don’t have an effect on STD transmission and you assume this to be true. You run your experiment, collect some data, and turns out you get some results that were very unlikely to get (meaning the probability of getting those results was really small). This might cause you to doubt the assumption you made about condoms having no effect. Why? Because you got results that were very rare to get, meaning your results were significant enough to cast doubt on your assumption that the null hypothesis was true.
Just like with most things in life, you want to minimize your probability of being wrong, including when performing a hypothesis test. So consider the ways you could be wrong when interpreting the results of a hypothesis test: you can either reject the null hypothesis when it’s actually true (a Type I error), or fail to reject it when it’s actually false (a Type II error).
Since you can’t decrease the chance of both types of errors without raising the sample size and you can’t control for the Type II error, then you require that a Type I error be equal to 5% which is a way of requiring that any statistically significant results you get can only have a 5% chance of being a coincidence. It’s damage control to make sure you don’t make an utter fool of yourself and this restriction leaves you with a 95% confidence when claiming statistically significant results and a 5% margin of error.
The statistically significant results in the above condom example could have been a fluke, just coincidence, but it’s only 5% likely. Even though there’s sound reason for having a small p-value, the actually threshold of 5% happens to be a convention created by Ronald Fisher, considered to be the father of modern statistics. This convention exists so that when a scientist talks about how they achieved statistically significant results, other scientists know that the results in question were significant enough to only be coincidence at most 5% of the time.
A fuzzy contradiction
For the mathematically literate, the null hypothesis test might resemble a fuzzy version of the scaffolding for a proof by contradiction whose steps are as such:
- Suppose hypothesis, $\mathrm{H}$, is true.
- Since $\mathrm{H}$ is true, some fact, $\mathrm{F}$, can’t be true.
- But $\mathrm{F}$ is true.
- Therefore, $\mathrm{H}$ is false.
Compared to the steps for a hypothesis test:
- Suppose the null hypothesis, $\mathrm{H_0}$, is true.
- Since $\mathrm{H_0}$ is true, it follows that a certain outcome, $\mathrm{O}$, is very unlikely.
- But $\mathrm{O}$ was actually observed.
- Therefore, $\mathrm{H_0}$ is very unlikely.
The difference between the proof by contradiction and the steps involved in performing a hypothesis test? Absolute mathematical certainty versus likelihood. You might be tempted into thinking statistics shares the same certainty enjoyed by mathematics, but it doesn’t. Statistics is an inferential framework and as such, it depends on data that might be incomplete or tampered with; not to mention the data could have been derived from an improperly-set-up experiment that left plenty of room for a plethora of confounding variables. Uncertainty abounds in the field and the best answer any statistician can ever give is in terms of likelihood, never certainty.
Actually doing the hypothesis test
Now onto the technical details of a hypothesis test. Although statistics classes somehow find a way to muddy the waters, the test itself is fortunately not too complicated. And once you understand these details, you can have a computer do the computations for you. For simplicity, assume you’re doing a hypothesis test about the effect of an intervention on a population by looking at its sample mean. But keep in mind that this procedure is very similar for other tests.
First, collect enough data (preferably at least 30 samples) from your population of choice without the intervention and calculate its mean, $\mu_0$. This is called a sample mean and represents the population mean because the Central Limit Theorem tells you that as you take larger and larger samples, the sample mean approaches the population mean. And since the sample mean is a statistic, it belongs to a particular sampling distribution which the Central Limit Theorem says is the Normal distribution.

Next, calculate the standard deviation of $\mu_0$ which is equal to $\frac{\sigma}{\sqrt{n}}$ where $\sigma$ is the population standard deviation and $n$ is the size of your sample. But since you don’t know what $\sigma$ really is, you can estimate it with the sample standard deviation, $S$, found in the data from the population with the intervention. So, collect over 30 samples from your population with the intervention and calculate its mean, $\mu$, and sample standard deviation, $S$.
Now assume the null hypothesis is true and ask yourself, what is the probability of getting $\mu$? Another way of saying that is, how many standard deviations is $\mu$ away from $\mu_0$ and what is the probability of getting a result at least that many standard deviations away from $\mu_0$? As mentioned earlier, this probability is called the p-value.
Well, to calculate how many standard deviations $\mu_0$ is away from $\mu$, you subtract $\mu_0$ from $\mu$ and divide by the standard deviation of $\mu_0$. The result is called a standard score or Z-score.
$$\frac{\mu - \mu_0}{S/\sqrt{n}}$$
Now what is the probability of getting a standard score that’s at least as extreme as the one you got? This is the same as asking what the probability is of at least $\frac{\mu - \mu_0}{S/\sqrt{n}}$ deviations from $\mu_0$. Well, this depends on the form of your alternative hypothesis.
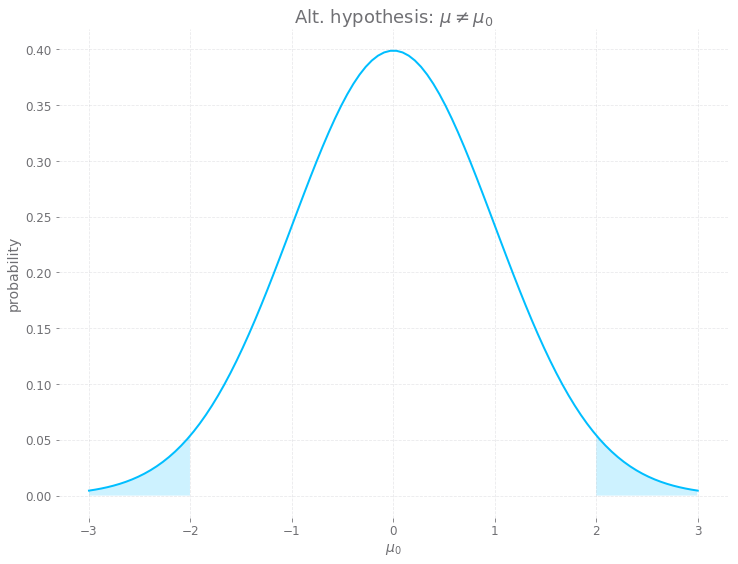
If your alternative hypothesis is that $\mu \neq \mu_0$, then the probability of the standard score is just one minus the integral from $-\frac{\mu - \mu_0}{S/\sqrt{n}}$ to $\frac{\mu - \mu_0}{S/\sqrt{n}}$ of the probability density function (pdf) for the Normal distribution. For example, if $\frac{\mu - \mu_0}{S/\sqrt{n}} = 2$, then “1 minus the integral above” will find the area of the shaded regions under the curve (which is the probability you’re looking for):

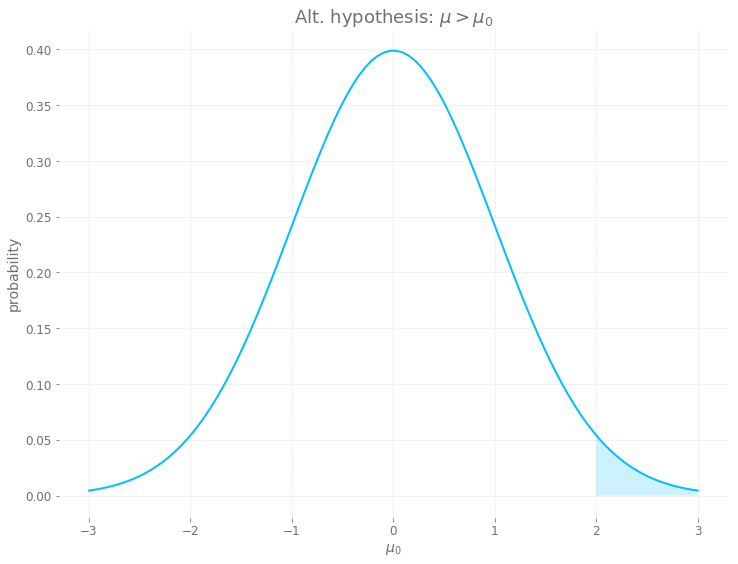
If your alternative hypothesis is $\mu > \mu_0$, then the probability of the standard score is the integral from $\frac{\mu - \mu_0}{S/\sqrt{n}}$ to $\infinity$ of the pdf for the Normal distribution. Assuming a standard score of two like in the example above, this equates to trying to find the area in the graph below:

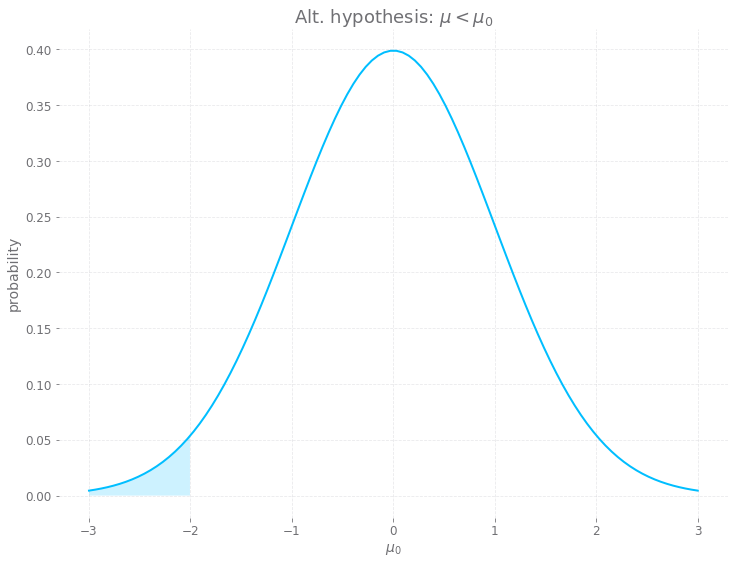
Similarly, if your alternative hypothesis is $\mu < \mu_0$, then the probability of the standard score is the integral from $- \infinity$ to $\frac{\mu - \mu_0}{S/\sqrt{n}}$ of the pdf for the Normal distribution. Like in the examples above, this time you’re trying to find the following area:

Now that you’ve found the probability of your results (via the standard score), you can use this probability to decide whether to reject the null hypothesis or not. Say this probability was 3%. So the data you gathered from the population after the intervention was applied had a 3% probability of happening under the assumption that the null hypothesis was true. But it happened anyway! So maybe the null hypothesis wasn’t true after all. You don’t know for sure, but the evidence seems to suggest that you can reject it.
Tuning the microscope
As mentioned before, hypothesis testing is a scientific instrument with a degree of precision and as such, you must carefully decide what precision is needed given the experiment. An underpowered hypothesis test would not be powerful enough to detect whatever effect you’re trying to observe. It’s analogous to using a magnifying glass to observe one of your cheek cells. But a magnifying glass is too weak to observe something so small and you might as well have not bothered with the test at all. Typically, a test is underpowered when studying a small population where the difference in the population creates an effect that’s just big enough to pass the p-value threshold of 5%.
In his book, “How Not to Be Wrong", Jordan Ellenberg gives a great example of an underpowered test. He mentions a journal article in Psychological Science that found married women in the middle of their ovulatory cycle more likely to vote for the presidential candidate Mitt Romney. A population size of 228 women were polled; of those women polled during their peak fertility period, 40.4% said they’d support Romney, while only 23.4% of the other married women who weren’t ovulating showed support for Romney. With such a small population size, the difference between the two groups of women was big enough to pass the p-value test and reject the null hypothesis (i.e. ovulation in married women has no effect on supporting Mitt Romney). Ellenberg goes on to say on page 149:
The difference is too big. Is it really plausible that, among married women who dig Mitt Romney, nearly half spend a large part of each month supporting Barack Obama? Wouldn’t anyone notice? If there’s really a political swing to the right once ovulation kicks in, it seems likely to be substantially smaller. But the relatively small size of the study means a more realistic assessment of the strength of the effect would have been rejected, paradoxically, by the p-value filter.
The opposite problem is had with an overpowered study. Say such an overpowered study (i.e. a study with a large population size) is performed and it showed that taking a new blood pressure medication doubled your chance of having a stroke. Now some people might choose to stop taking their blood pressure meds for fear of having a stroke; after all, you’re twice as likely. But if the likelihood of having a stroke in the first place was 1 in 8,000, a number very close to zero, then doubling that number, 2 in 8,000, is still really close to zero. Twice a very small number is still a very small number.
And that’s the headline - an overpowered study is really sensitive to small effects which might pass as statistically significant but might not even matter. What if a patient with heart disease suffered an infarction because he or she decided to stop taking their blood pressure meds after reading the “twice as likely to stroke” headline? The overpowered study took a microscope to observe a golf ball and missed the forest from the trees. Care must be taken when reading or hearing such headlines and questions must be asked. That all being said, in the real world an overpowered study is preferred to an underpowered one. If the test has significant results, you just need to make sure you interpret those results in a practical manner.
The importance of replicable research

Toward the beginning of this post, you saw that if the null hypothesis were true, you’re still 5% likely to reject it in favor of the alternative. That’s why you can only say you’re 95% confident in the results you get because 1 out of 20 times, your results aren’t actually significant at all, but are due to random chance. Test 20 different jelly beans for a link to acne and it’s not surprising that 1 out of 20 show a link.
This should hammer home the importance of replicable research, which entails following the same steps of the research, but with new data. Repeating your research with new data helps to ensure that you’re not that one lucky scientist who did the research once and found that green jelly beans had a statistically significant effect on acne.
Closing remarks
Hypothesis testing has been a godsend in scientific investigation. It’s allowed for the ability to focus efforts toward more promising areas of research and has provided the opportunity to challenge commonly held beliefs and defend against harmful actions. Now that you know how to perform a hypothesis test and are aware of the pitfalls, I hope it increases value not only in your profession but also in your personal life.